
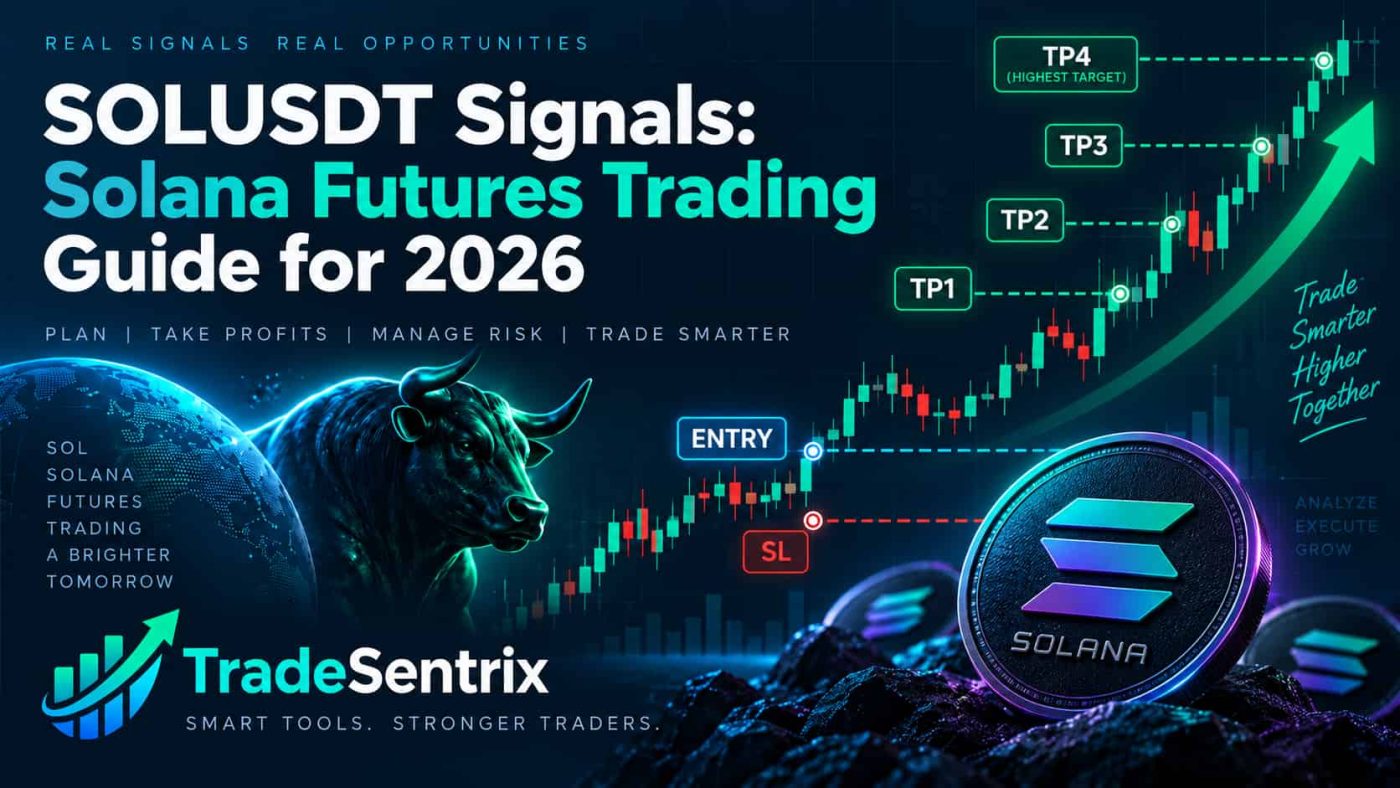
SOLUSDT Signals Futures Trading Guide for 2026
SOLUSDT futures can move rapidly when momentum expands. Solana often attracts active traders because it can produce clear directional swings, but the same volatility that creates opportunity can also make poor entries expensive.
A practical SOLUSDT signal needs more than a bullish or bearish opinion. It should define the Entry, Stop Loss, target structure and publication time, then give the trader enough information to decide whether the setup remains valid at the current price.
TradeSentrix includes SOLUSDT among its supported crypto markets and presents signals with structured levels rather than direction-only alerts.
Begin with Solana’s market structure
Before considering an entry, identify the current state of the SOLUSDT chart.
A bullish market commonly shows higher highs and higher lows. A bearish market shows lower highs and lower lows. A sideways market moves between support and resistance without sustained directional progress.
Structure matters because the same indicator reading can mean different things in different environments. A momentum signal inside a strong uptrend may support continuation, while the same reading in the middle of a range may produce repeated false entries.
Use higher timeframes for context and lower timeframes for execution
A common approach is to use a higher timeframe to understand the broader direction and a lower timeframe to refine the entry.
For example:
- 1-hour chart: identify trend and major support/resistance;
- 15-minute chart: locate the setup area;
- 5-minute chart: wait for confirmation and entry timing.
This does not mean every timeframe must point in exactly the same direction. The purpose is to avoid treating a short-term candle pattern as if it exists in isolation.
A 5-minute BUY setup against strong higher-timeframe resistance requires more caution than one forming after a confirmed higher-timeframe breakout.
Identify support, resistance and liquidity zones
SOLUSDT often reacts sharply around previous swing highs, swing lows, breakout levels and areas where price previously accelerated.
For a BUY setup, look for evidence that buyers are defending support or reclaiming a broken level. For a SELL setup, look for rejection from resistance or a confirmed breakdown.
Liquidity behavior can also matter. Price may briefly move beyond a recent high or low, trigger stops and then reverse. This is why traders should be careful about entering immediately on the first wick through a level.
The location of the setup matters as much as the direction.
Confirmation can reduce false entries
Solana can make strong intrabar moves that disappear before the candle closes. Confirmation helps distinguish an actual structural shift from temporary volatility.
Examples include:
- candle close above or below a key level;
- breakout followed by a successful retest;
- higher low after a bullish reclaim;
- lower high after a bearish breakdown;
- momentum and volume supporting the move.
No confirmation method eliminates losses. Its purpose is to create a repeatable rule for deciding when the setup becomes actionable.
Pay special attention to volatility
SOLUSDT can expand quickly during strong crypto market moves. A stop that is too tight may sit inside ordinary volatility, while a stop that is too wide can create excessive monetary risk if the position is not sized correctly.
The solution is position sizing.
If the correct technical invalidation is 4% away, the trader can reduce the quantity so that a 4% market move to the stop still produces an acceptable account loss. Increasing leverage does not improve the setup and should not be used as a substitute for proper sizing.
See the Binance Futures Risk Management guide for a fuller explanation.
Use volume as context, not as a standalone signal
Volume can help show whether a breakout has participation.
A SOLUSDT break above resistance with a meaningful expansion in volume may have stronger confirmation than a slow drift through the same level. However, high volume can also appear during liquidation events, exhaustion or a final spike before reversal.
Ask what price did after the volume arrived. Did the market hold above the breakout? Did it immediately reject? Did the next candle confirm or reverse the move?
Volume is most useful when connected to structure.
Momentum should confirm the setup, not replace it
Momentum indicators can help assess whether the market is strengthening or weakening.
For a BUY setup, improving momentum after a higher low can support continuation. For a SELL setup, momentum weakening during a failed rally can support the bearish thesis.
But an overbought reading does not automatically mean “sell,” and an oversold reading does not automatically mean “buy.” Strong trends can remain stretched for long periods.
The signal should still have a clear invalidation level.
Illustrative SOLUSDT BUY setup
Assume SOLUSDT is trending upward on the 1-hour chart. Price pulls back to a prior breakout area and forms a higher low. On the lower timeframe, price closes above local resistance with stronger volume.
A structured BUY plan could use the breakout/retest as Entry, place the Stop Loss below the higher low and use previous swing highs or measured resistance zones for TP1 through TP4.
The trade thesis weakens if price loses the reclaimed area and breaks the higher low.
Illustrative SOLUSDT SELL setup
Assume the higher timeframe is bearish. SOLUSDT rallies into a former support zone that now behaves as resistance. Price rejects the level, forms a lower high and closes below short-term support.
A SELL plan could use the failed retest as Entry, place the Stop Loss above the lower high and set profit targets at lower support zones.
Again, this is an educational example rather than a live trade recommendation.
Why late entries can destroy reward-to-risk
Suppose a SOLUSDT BUY signal is published at 150 with TP1 at 154 and a Stop Loss at 142. If a trader sees the alert only after price reaches 153.5, the remaining distance to TP1 is very small while the distance to the original stop is still large.
The historical signal may have performed correctly, but the late trader is no longer taking the same setup.
This is why every signal should be checked against the current price before execution.
Read How to Read Crypto Signal Entry, Stop-Loss and Take-Profit Levels for a complete pre-entry checklist.
How to use TP1, TP2, TP3 and TP4 on SOLUSDT
Multiple targets allow the platform to track the depth of the move.
During strong trends, SOLUSDT may progress through several targets. During weaker conditions, price may reach TP1 and then reverse.
A transparent historical record should preserve each target that was reached. If TP1 and TP2 are hit before a later Stop Loss event, those earlier targets should remain visible.
This makes it possible to evaluate not only the final outcome but also how far signals typically progress.
Solana versus broader crypto conditions
SOLUSDT does not trade in isolation. Broad Bitcoin direction, liquidity conditions and market-wide risk sentiment can influence Solana.
However, broad market context should not replace SOL-specific confirmation.
If Bitcoin is bullish but SOLUSDT is repeatedly failing at resistance and making lower highs, a SOL BUY signal still needs to explain why that local weakness has changed.
The strongest analysis combines market context with the asset’s own structure.
Common SOLUSDT trading mistakes
Oversizing because SOL is moving fast
Fast price action often tempts traders to increase size. Volatility should usually lead to more careful sizing, not more aggressive exposure.
Using a fixed Stop Loss distance on every setup
Different market conditions require different invalidation levels. Position size should adapt to the stop distance.
Buying directly into major resistance
Even a bullish trend can stall when the entry is too close to an important supply zone.
Selling after a large drop
Chasing a SELL after price has already moved near the targets can leave poor reward-to-risk and high reversal risk.
Moving the Stop Loss farther away
If the original setup is invalidated, widening the stop changes the risk plan after the fact.
How to evaluate historical SOLUSDT signal quality
Review a meaningful set of closed signals rather than a few recent winners.
Useful metrics include:
- TP1 hit rate;
- TP2 hit rate;
- TP3 and TP4 progression;
- Stop Loss frequency;
- Stop Loss after partial target progress;
- average signal age when delivered;
- results by trending versus ranging conditions;
- consistency of publication timestamps.
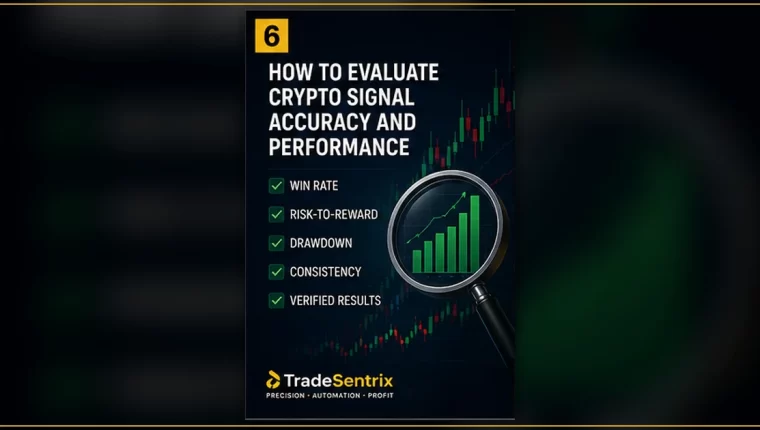
The article How to Evaluate Crypto Signal Accuracy and Performance explains why target definitions and complete loss reporting must remain consistent.
Frequently asked questions
Are SOLUSDT futures signals guaranteed?
No. Futures markets are uncertain, and Solana can move sharply in either direction.
Is SOLUSDT suitable for 5-minute trading?
It can be traded on short timeframes, but lower timeframes contain more noise. Stronger workflows combine short-term execution with higher-timeframe context and defined risk.
Should I use the same leverage on every SOL trade?
No. Leverage and quantity should reflect account risk, Stop Loss distance and market conditions.
Can SOLUSDT hit TP1 and later hit SL?
Yes. Price can progress through one or more targets and then reverse. Historical reporting should preserve both the target hits and the later stop event.
Where can I review structured SOLUSDT signals?
TradeSentrix lists supported crypto markets through its Crypto Signals and Binance Futures Signals pages.
Final takeaway
A high-quality SOLUSDT signal is defined by structure, levels, confirmation and risk—not by how exciting the market looks in the moment.
The trader should know where the setup becomes active, where it becomes invalid, which targets are realistic and whether the current price still offers acceptable reward relative to risk.
When volatility increases, reduce uncertainty with clearer rules rather than increasing exposure emotionally.
Risk notice: Solana and leveraged crypto futures can move rapidly and may result in substantial loss. This article is educational and does not provide personalized financial advice, a guarantee of profit or a recommendation to open a position.
Featured image prompt
Create a professional Solana futures trading education graphic: SOL symbol beside a dark candlestick chart, visible support/resistance zones, Entry, Stop Loss and TP1–TP4 labels, subtle volume bars, modern financial dashboard style, no guaranteed-profit imagery, 16:9 landscape.